Liverpool top xG Premier League table ahead of Man City, Chelsea and Leicester
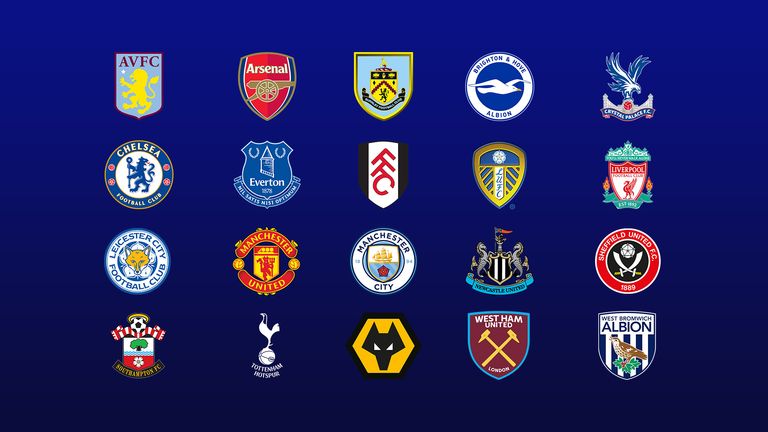
Wolves plummet into relegation zone above Burnley and West Brom, with Newcastle and Southampton close to drop zone; no moves for Man City, West Ham, Aston Villa, Arsenal and Crystal Palace
Tuesday 26 January 2021 08:37, UK
What would the Premier League table look like based on expected goals?
By the 19-game mark last season, 70 per cent of teams were within two places of their final position. Only Manchester United (rising five places) and Crystal Palace (falling five places) moved more than three spots over the second half of the campaign - but those positions do not always reflect a team's overall performances.
Clearly, goals will always be the most important statistic in football but, a sign of a strong team is also one that continually creates chances while limiting their opponents. Some of those sides might simply have been let down by their strikers or goalkeeper more often than others, or just been more unlucky at decisive moments.
By using Opta's Expected Goals model to create an alternative Premier League table, rewarding sides who have dominated their opponents in terms of xG - creating more or better chances - we can get further insight into this.
- Premier League table | Premier League top scorers
- Premier League fixtures | Premier League results
- Get Sky Sports
Title race ramifications
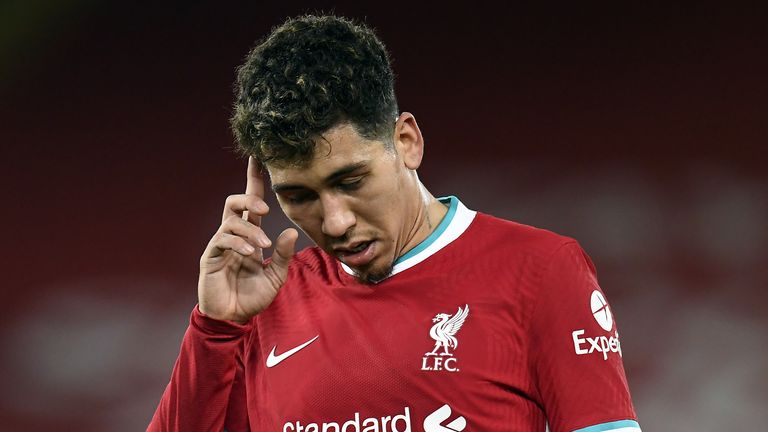
As for the title race, this table emphasises some of the struggles Chelsea and Liverpool have suffered in front of goal this season. Liverpool, in particular, might have been expected to win a number of additional matches with a more typical return in attack, underlined by their remarkable current run of 87 shots without a goal.
In contrast, Manchester United have been far more clinical than their rivals which, if maintained, could prove decisive come the end of the season.
While recent history suggests there might not be drastic positional changes over the rest of the season, this table can help show which direction sides might move. If some of the surprise risers on this table can resolve their issues at both ends, the fact they are regularly creating better chances than their opponents should translate into a better return over time - and an improved standing in the Premier League table that actually matters.
Brighton & Sheffield Utd underachieving?
The most striking change belongs to Brighton who, based on how many times they have created significantly better chances than their opponents, might have been expected to have double their current points total. It also suggests they might have had the same amount of wins as Manchester United, given more typical levels of end product at both ends.
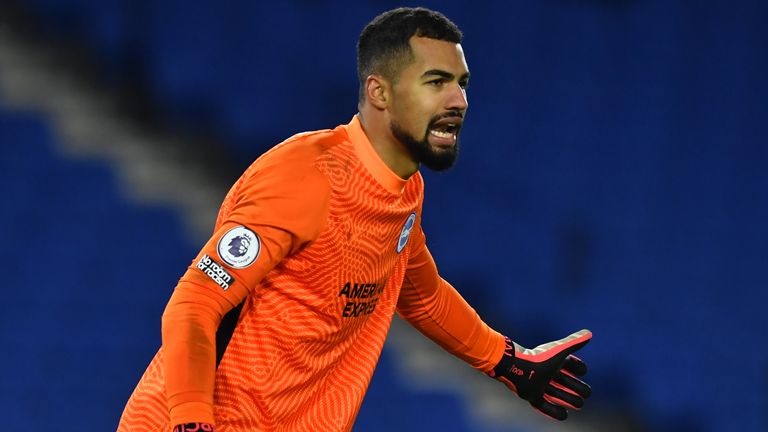
A clear contributing factor to this has been the return of Brighton's goalkeepers. Perhaps surprisingly, no Premier League side has faced fewer shots this season - a stat that would normally be associated with success.
Unfortunately for the Seagulls, though, that's accompanied by the fact they have the lowest save percentage in the division, of just 48 per cent, with the Premier League average being 67 per cent. Rather alarmingly, over half of their shots on target faced have been going in.
This table also doesn't consider Sheffield United as bad as their current position, though with more of those shortcomings associated with their forwards. The Blades' shot conversion is just 5.7 per cent this season - meaning they have needed almost 18 shots for every goal scored - which is not great for a side averaging just nine per game.
Southampton and Everton overachieving?
At the other end of the scale, Everton and Southampton have enjoyed strong seasons so far, with their positions boosted by some of the most clinical finishing in the Premier League.
Both are in the top four for shot conversion, needing around seven shots to score - but rank in the bottom seven for average shots per game. They also rank first and second in terms of shooting accuracy - the highest percentage of shots on target from their overall attempts - which helps propel them up this table.
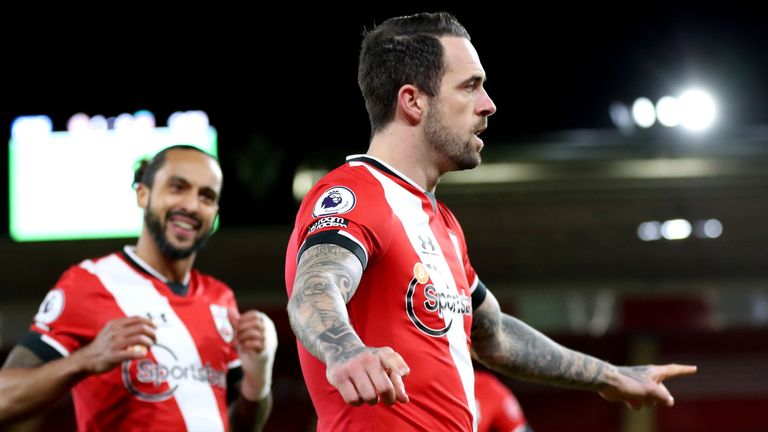
In terms of xG per game, Southampton actually rank in the Premier League's bottom five, yet the form of Danny Ings and company have often compensated for this.


